[astropark] Breaker Blocks, Supply Demand Order BlocksDear Followers,
today a new powerful indicator! Welcome to the great world of Breaker Blocks (BB) and Supply-Demand Order Blocks !
So what's the point? As always, the point is how to trade as safer as possible!
Breaker Blocks are price ranges where you simply have to wait for a pullback and sell-buy on its touch and price bounce, like in the screenshot below:
Supply and Demand are very important concepts, synonymous of Support and Resistance in most cases.
You should never sell whenever near a demand/support zone, unless price breaks through it as too weak. The same for supply/resistance: you should not buy near resistance, as most times you may start a trade with very high losing risk.
Here a screenshot how indicator works showing supply and demand order blocks (just enable them from indicator's option):
This indicator
can analyze chart based on high-low candle prices or open-close one
can show you Breaker Blocks (BB)
can show you Supply & Demand Order Blocks (OB)
lets you decide if you want to see high-low or open-close range of each OB
lets you edit the analysis window
lets you see local tops and bottoms of price as labels
This is a premium indicator , so send me a private message in order to get access to this script .
[b]forex

BEST Supertrend CCIHello traders
Today I present you a Supertrend not based on candle close but based on a CCI (Commodity Channel Index)
How does it work?
Bull event: CCI crossing over the 0 line
Bear event: CCI crossing below the 0 line
When the event is triggered, the script will plot the Supertrend as follow
UP Trend = High + ATR * Factor
DOWN Trend = Low - ATR * Factor
This is an alternative of the classical Supertrend based on candle close being above/beyond the previous Supertrend level.
Hope you'll enjoy it and it will improve your trading making you a better trader
Dave

TMA - PM The TMA
About TMA
Made by Rocket and PM
Used by 180+ users as of today
Was first published on Sept 8, 2019
It had 1 iteration so far.
Shouldn't have to be updated since the logic is set.
What is the TMA for?
The market moves in cycles/ranges and as a part of your trading you should try and figure out where in the range are you. Top of the range? Mid range? Bottom of the range? From that you'll know the potential downside/upside you have and you'll play your longs/shorts accordingly. The TMA helps with figuring out where are you in the range since its premise is that every asset moves up and down but within an avg range.
Use it with other indicators such as the RocketScalper or any other long/short indicator to get rid of noise and bad signals.
Start from higher tfs to see where the asset is headed. If you're near top tma, just start playing shorts. Do the reverse @ bottom tma. Expect bounces at mid tma.
Dont buy @ top tma and dont sell @ bottom tma.
Should I use it on all timeframes and all pairs?
Yes, add it, never remove it, use it on everything.

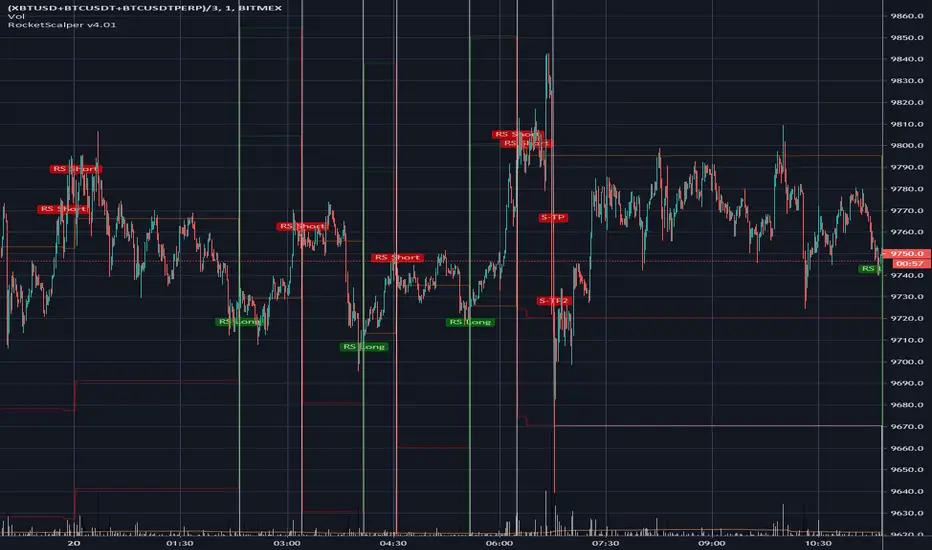
RocketScalper+ Long/Short IndicatorNOTE: To use together with RocketScalper Long/Short Indicator
About the Rocketscalper+ Indicator
Derives from the RocketScalper Long/Short indicator, was worked on by PM
Used by 180+ users as of today
Was first published on Sept 10, 2019
It had 1 iteration so far.
Will be updated as needed so it keeps giving good outputs (so far no update needed).
While the RocketScalper works by merging 3 oscillators and then checking the market balance between sells and buys to give you the final output, the RocketScalper+ uses MA Crossings and adds another layer to filter than final output. It IS NOT an upgrade, use both.
Main notes about the RocketScalper+:
Wavetrend ignored
Took weight off of Godmode for the final output
Added weight to Price Oscillator for the final output
Added TakeProfit and StopLoss conditions editable for users
Turned the scalper more neutral with a slight long bias for the upcoming trend
Has several outputs on the chart that you can activate/deactivate
Long / Short Signals
Self Explanatory / It suggests you should long or short the asset.
Show Price Oscillator signals
It'll output long/short signals based on the Price Oscillator.
Show Stop/Support/Resistance warning
Not working as of now, will need to update it soon.
No Text inputs on this indicator.
Should I use it on all timeframes and all pairs?
Yes, works very well with HTF and for all pairs. As you can see above on BTCUSDT (as an example), on the 6h use it as a confirmation to get in a trade, specially if you also use the TMA.
For access, please DM us or visit the link below in our Signature.

RocketScalper Long/Short IndicatorAbout the Rocketscalper Indicator
Was initially made by Rocket, PM, Hav0c, LiteralMonkey and PrimetimeBart.
It's our most used and advanced long/short indicator script so far, with over 450 users
Was first published in December 12, 2018.
It had 3 iterations, this is the 4th.
It has been continuously updated throughout the past year and as long as the market doesn't shift completely, it'll stay updated and giving good outputs.
It works by merging 3 oscillators and then checking the market balance between sells and buys to give you the final output.
Main notes about the 4th iteration:
RSI and Moving Averages back into the filtering conditions (for a while we removed it due to signal spam or trying to make a holy grail and i think we took steps back by doing that so they're back in)
Wavetrend settings closer to neutral
Loosened conditions on Godmode
Price Oscillator Changes
Added TakeProfit and StopLoss conditions editable for users
Turned the scalper more neutral with a slight long bias for the upcoming trend
Has several outputs on the chart that you can activate/deactivate
Long / Short Signals
Self Explanatory - It suggests you should long or short the asset.
Show Price Oscillator signals
It'll output long/short signals based on the Price Oscillator.
Show Stop/Support/Resistance warning
A warning label will pop-up when the trade is going against you. It's good to use as alerts, other than that, I wouldn't read much into it.
Plot Stop/Support/Resistance levels
It'll plot resistance and support horizontal lines in case you need guidance in your stops
Use background for Highlighting
It changes the background to red/green (or a color of your choosing) when its about to output a signal.
You also have, on the inputs tab, text inputs that you can edit such as:
Price Gain for Take Profit 1 and 2
Horizontal line (If you usually get at out at positive 50 points, put 50 in here and a line will plot once you get there) - Good for alerts.
Initial Stop Loss Percentage
Amount of $ Away from entry to Move SL After TP1
Trailing Stop Loss
Should I use it on all timeframes and all pairs?
You can, if you look at the historical outputs and they are good. However, I use it mostly on XBTUSD BTCUSDT ETHUSD XAUUSD and OILUS on LTF and HTF.
For altcoins, I would suggest only looking at 4h candlesticks and above.
For access, please DM us or visit the link below in our Signature.
PpSignal drake delay oscillatorDrake Delay Stochastic is a mt4 (MetaTrader 4) indicator and it can be used with any forex trading systems/strategies for additional confirmation of trading entries or exits use regression channel.
Buy when DDS is lime color and sell when the DDS is red.
Have background color aqua long and orange short.
have candle mode
have mtf mode.

Trendy Bar Trend ColorTrendy Bar Trend Color
Inspired by trend candlestick charts on other trading platforms. Changes bar colors to stay in trend much like Heikin Ashi candles without the ATR price distortion. This is done by comparing the HL2 and/or Open-Close values of current candlestick to the prior candlestick.

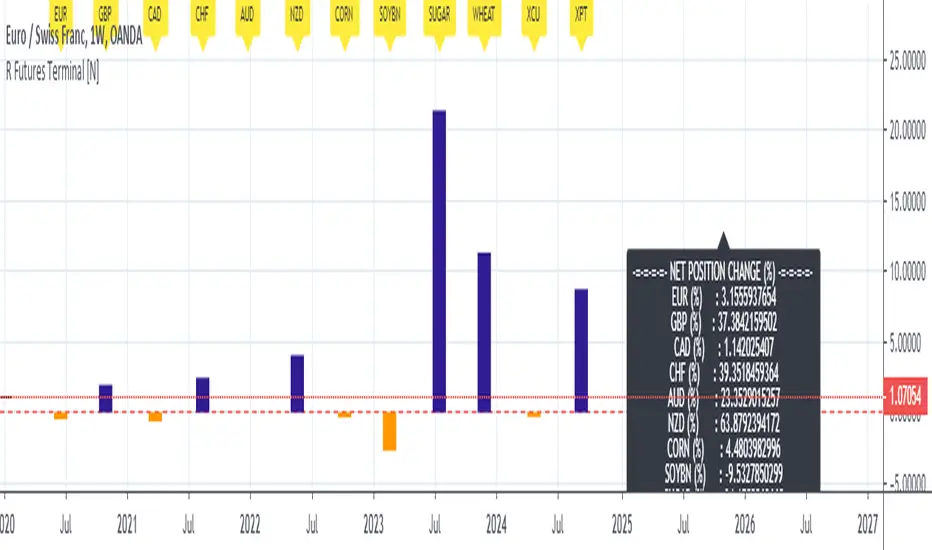
Live Mini Terminal 3 : Relative Forex & Futures Change DataThis script displays relative data changes occurring in the adjustable period and/or adaptive automatic period in the rest liquid futures.
It was inspired by the data terminals used by commercial traders.
Period selection can be set in the menu.
This script uses the adaptive period algorithm used by Autonomous LSTM and Relativity scripts.
Or you can set the period manually from the menu.
For more information about adaptive period:
This script works only for 1 day (1D) and 1 week (1W) time frames.
Since COT data is used, the most efficient time frame is 1 week (1W) .
Features
Value changes on a percentage basis (%)
Commitment of Traders position changes on a percentage basis :
Net position percentage is calculated as Short - Long and there is no inverse relationship.
Direct relationship is provided.
Due to the advantage of movement, future data were drawn instead of spot values on the required instruments.
The script provides the opportunity to comment on all major and minor Forex parities with liquid futures.
INSTRUMENTS
Euro Futures (EURUSD)
British Pound Futures (GBPUSD)
Canadian Dollar Futures (CADUSD)
Swiss Franc Futures (CHFUSD)
Australian Dollar Futures (AUDUSD)
New Zealand Dollar Futures (NZDUSD)
Corn Futures
Soybeans Futures
Sugar Futures
Wheat Futures
Copper Futures (XCU)
Platinum Futures (XPT)
Position Change InfoPanel
Position definition for the related instruments and data were taken and the calculations were made.
USAGE
The script can be used as an indicator by putting it under the chart as shown above.
It is necessary to enlarge to see clearly.
Since it is not often looked at, such use under chart is the best method for healthy interpretation.
Regards.
[astropark] Support Resistance Trendlines Swing PointDear Followers,
I'm very happy to publish this new tool, which will help you easily find
basic trend momentum (red if a bearish momentum is found, green viceversa)
Support Levels (where you can place your buy orders or short targets)
Resistance Levels (where you can place your sell orders or long targets)
Trendlines , known as diagonal supports and resistances (if price breaks a green one, then it's time to buy/long! otherwise if price breaks a red one, then it's time to sell/short)
Donchian Channel , which will memorize for you latest highs and lows, which may get retested for example
Swing Point , very useful point where to open a position while price holding above or below it
This script:
works on all timeframes
lets you edit each support-resistance cloud settings
lets you activate a third support-resistance cloud if you like
lets you choose if enable only one or disable all of them or whatever combination...
lets you choose to enable or disable trendlines, basic trend, donchian channel, swing point, etc... So very customizable user experience!
This is a premium indicator , so send me a private message in order to get access to this script.

ATR CHANNEL .2Channel based on 100MA & daily ATR / volatility - whole point is to warn and show you where not to participate. Signals can be considered as higher probability trades, short term reversal type scalps - especially effective at FX and stock trading

TRENDSPOTTERHi Guys,
So TrendSpotter uses multiple indicators to catch trend moves as they happen. All you have to do it follow the entries when 2 green or red arrows appear, you enter the move.
Basically it has a few rules.
1.I trade the 1 min time-frame
2.The background turns Red ( Short ) or Green ( Long ) when the stock is going that direction.
3. Wait until the Psar is under for Long and over for Short.
4. Wait until the second Green for Long or Red for Short Arrow to appear. You are getting in on the end of the first one.
Here's my profile on Tradingview.com with all the explanations of how to use it. It can be used for FOREX and CRYPTO also.
www.tradingview.com
Check out my videos to see it's not that complicated.
If you have any questions please contact me.
Thanks,
Enda

PpSignal RSI Haiken ashiPpSignal rsi Heiken Ashi is rsi smooth by elder formula and Heiken Ashi calculation.
Buy when the price is above on the RSI offset line (yellow).
Sell when the price is bellowed of RSI offset line (yellow).
for best results use the chart in bars style and turn on the bar color.

PpSignal Elder Universal Oscillator on the chartwe have the universal oscillator on the chart indicator.
is very simple to trade.
buy when the UO is green and sell when the UO is red.
The indicator has offset move average color yellow and super smooth elder move average...
PpSignaldouble rsi cross alertthis indicator is rsi open and rsi close in the same chart and qqe move average.
open is green rsi line and close is red, when close is above open and qqe ma is blue for examples is a good signal, and vice-versa.
have got oversold and overbought background alert too.
Consider rsi divergences and the trend before entering to the market
Buy when rsi is oversold and qqe ma is in blue color.
sell when the rsi is overbought red background and qqe is red.

ZoneBand (@Mido_yuiya)Bollinger band is converted to EMA , and support and resistance bands are made into regions

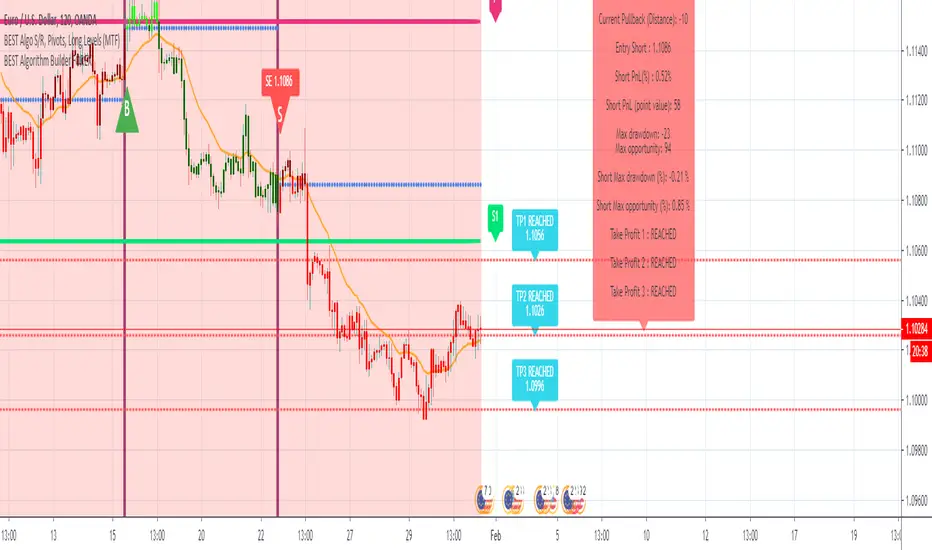
BEST Algorithm Builder FOREXHello traders 👋
I. 💎 SCRIPTS ACCESS AND TRIALS 💎
1. Every trial request access has to be done through my website.
2. My website URL is in this script signature at the very bottom (you'll have to scroll down a bit and going past the long description) and in my profile status available here: Daveatt
3. Many video tutorials explaining clearly how all our indicators work are available on our website > guides section and also on Discord + Youtube
4. You may also contact me directly for more information regarding the trading method included in the indicator or how to access it
II. Forewords
This indicator is for the Intraday FOREX traders looking for fixed entries based on our proprietary trading method.
We've been working on it for months and releasing now for our subscribers.
We designed this framework for FOREX major/minor/exotic pairs.
III. Optimized system for lowering risk/capturing most of the opportunities
We worked hard on reducing the risk as much as we could.
The built-in hard-exit (also called invalidation) system does a huge job in exiting a position way before a Stop Loss will get hit
EUR/USD
USD/CAD
IV. Trade Manager and compatible with dynamic alerts
It includes :
- our proprietary method with fixed entries
- a hard exit system (built-in stop-loss)
- multiple options for user-defined stop-loss/take-profit settings (price value, distance in pips, percentage, trailing, ...)
- 🔔 Compatible with dynamic alerts 🔔
Dynamic alerts are bringing automated trading to a whole new level. The third-party solutions capturing TradingView alerts are able to use them.
- Algorithmic Supports and Resistances used as safeguards and take profit zones
Final words
We made it as simple as we could (to be honest it's a very simple system for the end-user) - even with several hundreds of calculations in the indicator.
Please hit me up for any questions/feedbacks/comments
Become the BEST trader you deserve to be
Dave
[astropark] Renko OBV divergencesDear Followers,
today a new great Scalper Tool , based on Ob Balance Volume (OBV) oscillator, which works from 1 minute timeframe Renko chart , which is the best and more secure timeframe to use on a Renko chart. But of course it works great on all timeframes (included the 1D timeframe), both on FOREX and on Cryptocurrencies!
This tool has some cool features:
it works on all timeframes , starting from 1 minute: so you can enjoy high-frequency trading by using a 24/7 running bot and a proper money and risk management strategy
it shows you both bullish and bearish divergences with a triangle up or down respectively
when it finds a strong bullish/bearish divergence , a flag will be displayed instead of a triangle
This script will let you set all notifications you may need in order to be alerted on each triggered divergence.
You may like to use it together with my Renko Scalper V2
and my Renko RSI Divergences indicator
On Bitmex/ByBit/Binance Bitcoin/USD chart best settings is Traditional Renko chart with 10$ box size, while 0.5$ box size is suggested on Ethereum/USD pair.
This is a premium indicator , so send me a private message in order to get access to this script.

[astropark] Bullish Bearish Divergences for all OscillatorsDear Followers,
today a new great Scalper Tool , which works excellent on all timeframes and charts , both FOREX and Cryptocurrencies!
It alerts you when a new divergence has been spotted on the chart based on your preferred oscillator or set of oscillators ( yes, you can combine them! )
Here the list of currently supported oscillators (more in the future):
RSI (Relative Strength Index)
MACD
MACD Histogram
Stochastic
Stochastic RSI
CCI (Commodity Channel Index)
Momentum
Volume Oscillator
OBV (On Balance Volume)
VWmacd
Bollinger Bands %B
William %R
Chaikin Money Flow
Chaikin Oscillator
AO (Awesome Oscillator)
DPO (Detrended Price Oscillator)
Ultimate Oscillator
RVI (Relative Volatility Index)
Klinger Oscillator
This script will let you set all notifications you may need in order to be alerted on each triggered divergence (both regular and hidden).
This script:
works on all timeframes , starting from 1 minute: so you can enjoy high-frequency trading by using a 24/7 running bot and a proper money and risk management strategy if you like
shows you both bullish and bearish divergences, both regular and hidden , with a triangle up or down respectively
lets you activate more than one oscillator at the same time
lets you choose to be alerted only if all active oscillators agree on spotted divergence , so you will get only stronger and more secure ones (you can set both all or at least a configurable number of enabled oscillators)
lets you edit basic configuration settings of each oscillator
lets you disable or enable hidden divergences on chart
This is a premium indicator , so send me a private message in order to get access to this script.

[astropark] Renko RSI divergencesDear Followers,
today a new great Scalper Tool , which works excellent from 1 minute timeframe Renko chart , which is the best and more secure timeframe to use on a Renko chart. But of course it works great on all timeframes (included the 1D timeframe)!
This tool has some cool features:
it works on all timeframes , starting from 1 minute: so you can enjoy high-frequency trading by using a 24/7 running bot and a proper money and risk management strategy;
it shows you both bullish and bearish divergences with a triangle up or down respectively
when it finds a strong bullish/bearish divergence , a flag will be displayed instead of a triangle
This script will let you set all notifications you may need in order to be alerted on each triggered divergence.
You may like to use it together with my Renko Scalper V2
On Bitmex/ByBit/Binance Bitcoin/USD chart best settings is Traditional Renko chart with 10$ box size, while 0.5$ box size is suggested on Ethereum/USD pair.
This is a premium indicator , so send me a private message in order to get access to this script.

Entry Point IndicatorIndicator detects entry point on differents markets and timeframes
Suggested timeframes: from 1 hour to 1-week chart

Mirror TSI-MACD by Trader JayI was playing around with the TSI-MACD and surprisingly it works quite well as a mirror.
There are 2 ways this can be used
1. Enter long when Blue line crosses up the Red
2. Exit long when Green line crosses the blue
or
1. Enter long when Blue line crosses up the Red
2. Exit long when Blue line crosses back down below the Red

PpSignal RSI Bands Version 2This the mtf Rsi on the chart version
look at the picture and you can understand everything.
You have on the chart the middle line 50 overbought 70 and oversold lever 30 , like the oscillator in bellow out the chart.
we added Bollinger band 20, 1 and qqe move average, rsi on the chart (green and red line with circles), Heiken Ashi rsi style and rsi offset move average (yellow color).
Enjoy it

MKAST V2 (monthly)PLEASE READ THE ENTIRE POST BEFORE PURCHASING & USING THE MKAST Algorithm. Saves you and me some time in emails and messages. :)
This is the NEW MONTHLY ACCESS Version of the MKAST
The MKAST Buy Sell Algorithm is a very specific strategy, cut down to its roots and made perfect for the volatile crypto market.
Many Algorithms focus only on one aspect, one side, one specific rule.
As you know, this is not how life, the market or anything else works.
MKAST combines many different aspects at the same time, scans multiple other Algorithms and comes to a conclusion based on over 1350 lines of code.
It is based on Divergences, Elliott Waves , Ichimoku , MACD , MACD Histogram, RSI , Stoch , CCI , Momentum, OBV, DIOSC, VWMACD, CMF and multiple EMAs.
Every single aspect is weighted into the decision before giving out an indication.
Most buy/sell Algorithms FAIL because they try to apply the same strategy to every single chart, which
are as individual as humans.
To conquer this problem, MKAST has a wide range of settings and variables which can be easily
modified.
To make it a true strategy, MKAST has as well settings for Take Profit Points, Multiple Entries and Stop
Losses. Everything with an Alert Feature of course.
I know from experience that many people take one Algorithm and are simply too LAZY to add multiple Algorithms to make a rational choice.
The result of that is that they lose money, by following blatantly only one Algorithm.
MKAST has additional 9 Indicators, perfect for the crypto market, which can be turned on and off.
Manual
MKAST Signals Settings
“Show Signals?” - On/Off to show the Buy/Sell Signals.
“Aggressiveness” - Increase to make the signals less aggressive and decrease to make them more aggressive.
“Show Custom Signals?” - On/Off to show custom MKAST Signals as chosen in the settings below.
“Custom Buy/Sell Aggressiveness” - Choose a custom Aggressiveness for each buy and sell signal individually.
“TJ-Index Requirement For Buy/Sell” - If the TJ-Index is below the given number, it will show the signal in grey, this also applies for normal signals. Buy 0 and Sell 15 shows all signals in their original colour again.
“Don’t show signals that don’t meet index requirement?” - Checked, it will completely not show signals which would be “grey” as in the explanation above.
“Change Backgroundcolour if index is at 15 or 0?” - Checked, changes the colour of the chart if the index is at 15 or 0 points
MKAST Panel Settings
“Show Info Panel?” - Shows Info Panel on the chart.
“Move Info Panel UP by %” - Moves Info Panel up/down.
“Move Info Panel Left/Right ” - Moves Info Panel Left/Right.
“Show BitMEX Panel?” - Shows BitMEX Panel on the chart.
“Move BitMEX Panel by % ” - Moves BitMEX Panel up/down.
“Move BitMEX Panel Left/Right” - Moves BitMEX Panel Left/Right. “Signal Source” - Choose source of candle open/close for Equity calculation.
“Leverage Used?” - Select the used Leverage for your strategy and Equity calculation.
“Fees Per Trade in % ” - Deducts these fees after each trade from Equity calculation.
“Round Current Profit Price?” - Rounds the number on the Panel. “Trading Periods ” - Choose a trading Period which will be used to calculate Period Equity.
“Show separations of each Trading Period?” - Show separations on the chart of each Trading Period.
The very new feature on Tradingview and obviously now as well on MKAST are Information Panels.
I have chosen to add an Info Panel and a BitMEX Price Panel into MKAST, to make live and even
backtesting easier.
With only one blink of an eye the user is able to see ALL relevant information, without having to go
through various ways of checking and using other tools.
The Info Panel:
The first row shows the current profit. This is calculated since the signal initiation and the current candle close. Followed by a single number, which represents the current TJ-Index, removing the need of having to add the actual TJ-Index Oscillator on the chart.
The second row shows the current position and its status. This was added on request of many users wanting to know if their position is “about to change” or not. The status shows the users if the position is “endangered” or “okay”.
Followed by the “backtesting tool” already included inside the Panel. No need for complex oscillators with a hard reading for backtesting. With this one and simple panel, you see the Period Equity for the period chosen previously in the settings. This calculates all profits made inside that period and re-sets when the period ends. Right next to it, the Total Equity calculating ALL profits since the beginning of the chart.
Right below, you see the information about the last long and short position which have been open. This helps with the evaluation and documentation of the last trade.
The BitMEX Panel:
A convenient panel which shows all BitMEX contracts and their LIVE prices. The need for opening each chart goes away, the quality and experience of trading increases.
MKAST custom Signals are one of the notorious possibilities for ADVANCED strategies with MKAST.
Users who requested these features and use them frequently are the ones, having already a very unique trading strategy and they use these very custom signals as confluence or for multiple entry trades.
These custom signals and their settings can be mostly ignored by the majority of traders who are using this Algorithm.
The idea behind the grey signals has its roots in the idea of the TJ-Index. The TJ-Index being 15 Algorithms and conditions possible showing a bullish or bearish interpretation. The index counts the Algorithms which are showing a bullish interpretation.
Like that we can make sure that signals are shown in the original colour, are only those who have an additional confluence with the TJ-Index, not letting the user buy, if at least the majority is not bullish , and not letting the user sell, if at least the majority is bearish .
The custom buy and sell aggressiveness lets the user customise the MKAST algorithm even more.
Either the users wants to see how signals are changing on a different (slightly lower or higher) aggressiveness, being able to expect a change on their own settings. OR seeing that some signals of the same sort are a little out of place and is able to move these to a different aggressiveness, increasing the profitability even more.
Needless to say, custom signals are NOT a part of the Info Panel.
MKAST Label & Trendline Settings
“Show Labels?” - On/Off to show Labels above each signal, with the percentage gain or loss, calculated from the last signal to the new signal.
“Show Trendlines?” - On/Off to show automatic Trendlines following Gainzy Lines.
“Lookback Length” - Choose a length that the automatic trendiness use for calculation. Comparable to Aggressiveness.
“Wicks//Bodies” - Change between trendiness connecting from wick to wick or from body to body.
“Black lines// Coloured lines” - Change between simply black lines or changing colour lines.
“Filter Trendlines?” - On/Off to show all trendiness or just resistance decreasing and support increasing ones.
“Limit Extensions Of The Lines?” - This value increases by how much the trendiness are being extended. 0 = endless extension, otherwise 100 = maximum custom extension.MKAST Strategy “Take Profit 1” - On/Off to show TP1 points.
“Take Profit After %” - Set the percentage after which TP1 is active.
“Take Profit 2 ” - On/Off to show TP2 points.
“Take Profit 2 After %” - Set the percentage after which TP1 is
active.
“Take Profit 3” - On/Off to show TP3 points.
“Take Profit 3 After %” - Set the percentage after which TP1 is active.
“Second Entry” - On/Off to show Second Entry points.
“Second Entry After %” - Set the percentage after which Second Entry is active.
“Third Entry” - On/Off to show Third Entry points.
“Third Entry After %” - Set the percentage after which Third Entry is active.
“Stop Loss” - On/Off to show Stop Loss points.
“Stop Loss After %” - Set the percentage after which Stop Loss is active.
MKAST Strategy
To make the life of the MKAST user even easier, I have added all adjustable Take Profit Points, Multiple entry points and Stop Loss points.
I have never seen a sustainable and reliable trading strategy without TPs, Multiple entry and especially without a stop loss. Everything in the usual and fully customisable MKAST style.
Simply choose how many Take Profit points you would like to have and choose the percentage after which you would like to see the Take Profit point appear on the chart and notify you to take profits.
Are you a Trader who likes Multiple Entries? Also no problem with MKAST. Select how many additional entries you would like to have and after how many percent you would like them to appear on the chart and remind you of adding to the position.
What would a Strategy be without a Stop Loss? Same settings apply here as on the TPs and MEs .
All of the settings are able to take fractions of a number as well. This enables users to even use all of the strategy settings for scalping or FX pairs, where high leverage and the smallest of moves are used for trading.
Needless to say, all of these settings work on RENKO and Heikin Ashi as well. These might need adjustment, since the calculation is different, yet there is nothing standing in the way of it anymore.
Crypto Modified Indicators
“Show Divergences?” - On/Off to show Divergences on the Chart based on the data of 10 different Algorithms.
“Show Oversold/bought?” - On/Off to change the colour of the chart in Oversold/bought conditions.
“Oversold/bought value?” - Choose a value for which the chart is Oversold/bought.
“Show Fibonacci Levels?” - On/Off to show automatic Fibonacci Levels.
“Fibonacci Lookback Lenght” - This value states how many candles from right now are taken into account to paint the Fibonacci Levels.
“Fibonacci Custom Period” - Choose a custom Timeframe that should be used to paint the Fibonacci Levels.
“2nd-7th Fibonacci Level” - Enter a value for the Fibonacci Levels you would like to use and see on the chart.
“Plot 1.618 Level?” - On/Off for the Fibonacci extension level.
Crypto Modified Indicators
“Show Bands?” - On/Off to show the TJ-Bands on the chart.
“Bands Length” - Choose a value for the TJ-Bands Lenght
“Show Show EMA 1-3?” - On/Off to show the EMAs 1-3 on the chart.
“EMA Lenght 1-3” - Choose a value for the first to third EMA Lenght
“Show Ichimoku? ” - On/Off to show Ichimoku on the chart.
“Show Tenkin?” - On/Off to show Tenkin on the chart. “Tenkin” - Set the lenght of the Tenkin.
“Show Kijun?” - On/Off to show Kijun on the chart.
“Kijun” - Set the lenght of the Kijun.
“Show Senkou?” - On/Off to show the Senkou on the chart. “Senkou” - Set the lenght of the Senkou.
“Displacement” - Set the value of the Displacement.
“Show Chikou Span?” - On/Off to show the Chikou Span on the chart.
Crypto Custom Indicators
In the picture above, you see the first pair of Crypto Custom Indicators. The oversold and overbought conditions are highlighted.
Bullish and Bearish divergences are also plotted on the chart.
This is personally my favourite combination of Indicators and MKAST settings. It shows nicely
everything one needs to know and makes it easier to decide wether to follow a signal or not.
We here as well a perfect example of the Automatic Fibonacci Lines (Lookback 50, Timeframe 1D).
It shows all significant levels, which we can see being respected.
Orange = 23.6%, Green = 38.2%, Red = 50%, Yellow = 61.8%, Blue = 78.6%, White = 0%;100%
In this picture above, we observe the perfect ensemble of MKAST and an EMA strategy, especially modified for crypto markets.
Here, as by default, we have the EMAs at 21, 90 and 200. These have shown to be very significant moving support and resistance points in the crypto market.
In this picture above, I lowered the timeframe to show the highly significant levels of the Ichimoku . It has not the “usual values”. These here have been modified for the volatile crypto market and set as default.
An incredibly powerful tool for anyone who is ready to step up their trading game. It is a huge part of the MKAST back end and the strategy behind it.
MKAST Custom Alerts
1
MKAST without any doubt has Custom Alerts for all Signals that it is painting on the chart.
One can even choose to receive custom notifications for Take Profit points, Multiple Entry points and
the Stop Loss points.
The signals appear on the chart DURING the candle, not at the end of the candle. Therefore, the
alerts do this as well. These appear during the candle.
Here we can see all of the possible Alerts that can be chosen to be displayed. In total it is 14 different custom alerts, based on what the trader is looking for and how he is trading.
Personally, I have 10-15 coins that I trade the most and for these I have custom notifications, mostly though only the MKAST Buy/Sell and Stop Loss Signals.
To activate Alerts for MKAST,
1) Go to the “ALERT” icon on the top tool bar of your Tradingview.
2) Select “CONDITION” as “—MKAST—“
3) Then choose ONE condition from the list of conditions.
4) On “OPTIONS” you can set how many times it appears, I have “Once per Bar”.
4.1) If you want to make sure that the signal is truly there and not just a condition for a second during the candle, choose “ONCE PER BAR CLOSE”.
5) “Expiration Time” sets the time until the alert expires. PRO users have no expiration for alerts.
6) “Alert Actions” give you a row of choices what happens and how you want to be notified.
7) “Message” is the message that you receive inside the notification.
Thank you, Kong
